Performance
2. dmesg | tail
$ dmesg | tail
[1880957.563150] perl invoked oom-killer: gfp_mask=0x280da, order=0, oom_score_adj=0
[...]
[1880957.563400] Out of memory: Kill process 18694 (perl) score 246 or sacrifice child
[1880957.563408] Killed process 18694 (perl) total-vm:1972392kB, anon-rss:1953348kB, file-rss:0kB
[2320864.954447] TCP: Possible SYN flooding on port 7001. Dropping request.  Check SNMP counters.
This views the last 10 system messages, if there are any. Look for errors that can cause performance issues. The example above includes the oom-killer, and TCP dropping a request. Don’t miss this step! dmesg is always worth checking.
kernel会将开机信息存储在ring buffer中.您若是开机时来不及查看信息,可利用dmesg来查看。开机信息亦保存在/var/log目录中,名称为dmesg的文件里。
5. pidstat 1
$ pidstat 1
Linux 3.13.0-49-generic (titanclusters-xxxxx)  07/14/2015    _x86_64_    (32 CPU)

07:41:02 PM   UID       PID    %usr %system  %guest    %CPU   CPU  Command
07:41:03 PM     0         9    0.00    0.94    0.00    0.94     1  rcuos/0
07:41:03 PM     0      4214    5.66    5.66    0.00   11.32    15  mesos-slave
07:41:03 PM     0      4354    0.94    0.94    0.00    1.89     8  java
07:41:03 PM     0      6521 1596.23    1.89    0.00 1598.11    27  java
07:41:03 PM     0      6564 1571.70    7.55    0.00 1579.25    28  java
07:41:03 PM 60004     60154    0.94    4.72    0.00    5.66     9  pidstat

07:41:03 PM   UID       PID    %usr %system  %guest    %CPU   CPU  Command
07:41:04 PM     0      4214    6.00    2.00    0.00    8.00    15  mesos-slave
07:41:04 PM     0      6521 1590.00    1.00    0.00 1591.00    27  java
07:41:04 PM     0      6564 1573.00   10.00    0.00 1583.00    28  java
07:41:04 PM   108      6718    1.00    0.00    0.00    1.00     0  snmp-pass
07:41:04 PM 60004     60154    1.00    4.00    0.00    5.00     9  pidstat
Pidstat is a little like top’s per-process summary, but prints a rolling summary instead of clearing the screen. This can be useful for watching patterns over time, and also recording what you saw (copy-n-paste) into a record of your investigation. The above example identifies two java processes as responsible for consuming CPU. The %CPU column is the total across all CPUs; 1591% shows that that java processes is consuming almost 16 CPUs.
8. sar -n DEV 1
sar命令用于收集、报告、保存系统活动信息。sar工具是sysstat软件包的一部分。
使用cron开启自动化记录报告的示例:
[root@zyg ~]# cat /etc/cron.d/sysstat
# Run system activity accounting tool every 10 minutes
*/10 * * * * root /usr/lib64/sa/sa1 -S DISK 1 1
# 0 * * * * root /usr/lib64/sa/sa1 -S DISK 600 6 &
# Generate a daily summary of process accounting at 23:53
53 23 * * * root /usr/lib64/sa/sa2 -A
sa1命令用来将二进制数据收集和存储到/var/log/sa/sadd文件,dd参数表示当前天的日期。
$ sar -n DEV 1
Linux 3.13.0-49-generic (titanclusters-xxxxx)  07/14/2015     _x86_64_    (32 CPU)

12:16:48 AM     IFACE   rxpck/s   txpck/s    rxkB/s    txkB/s   rxcmp/s   txcmp/s  rxmcst/s   %ifutil
12:16:49 AM      eth0  18763.00   5032.00  20686.42    478.30      0.00      0.00      0.00      0.00
12:16:49 AM        lo     14.00     14.00      1.36      1.36      0.00      0.00      0.00      0.00
12:16:49 AM   docker0      0.00      0.00      0.00      0.00      0.00      0.00      0.00      0.00

12:16:49 AM     IFACE   rxpck/s   txpck/s    rxkB/s    txkB/s   rxcmp/s   txcmp/s  rxmcst/s   %ifutil
12:16:50 AM      eth0  19763.00   5101.00  21999.10    482.56      0.00      0.00      0.00      0.00
12:16:50 AM        lo     20.00     20.00      3.25      3.25      0.00      0.00      0.00      0.00
12:16:50 AM   docker0      0.00      0.00      0.00      0.00      0.00      0.00      0.00      0.00
^C
Use this tool to check network interface throughput: rxkB/s and txkB/s, as a measure of workload, and also to check if any limit has been reached. In the above example, eth0 receive is reaching 22 Mbytes/s, which is 176 Mbits/sec (well under, say, a 1 Gbit/sec limit). This version also has %ifutil for device utilization (max of both directions for full duplex), which is something we also use Brendan’s nicstat tool to measure. And like with nicstat, this is hard to get right, and seems to not be working in this example (0.00).
9. sar -n TCP,ETCP 1
$ sar -n TCP,ETCP 1
Linux 3.13.0-49-generic (titanclusters-xxxxx)  07/14/2015    _x86_64_    (32 CPU)

12:17:19 AM  active/s passive/s    iseg/s    oseg/s
12:17:20 AM      1.00      0.00  10233.00  18846.00

12:17:19 AM  atmptf/s  estres/s retrans/s isegerr/s   orsts/s
12:17:20 AM      0.00      0.00      0.00      0.00      0.00

12:17:20 AM  active/s passive/s    iseg/s    oseg/s
12:17:21 AM      1.00      0.00   8359.00   6039.00

12:17:20 AM  atmptf/s  estres/s retrans/s isegerr/s   orsts/s
12:17:21 AM      0.00      0.00      0.00      0.00      0.00
^C
This is a summarized view of some key TCP metrics. These include: active/s: Number of locally-initiated TCP connections per second (e.g., via connect()). passive/s: Number of remotely-initiated TCP connections per second (e.g., via accept()). retrans/s: Number of TCP retransmits per second. The active and passive counts are often useful as a rough measure of server load: number of new accepted connections (passive), and number of downstream connections (active). It might help to think of active as outbound, and passive as inbound, but this isn’t strictly true (e.g., consider a localhost to localhost connection). Retransmits are a sign of a network or server issue; it may be an unreliable network (e.g., the public Internet), or it may be due a server being overloaded and dropping packets. The example above shows just one new TCP connection per-second.
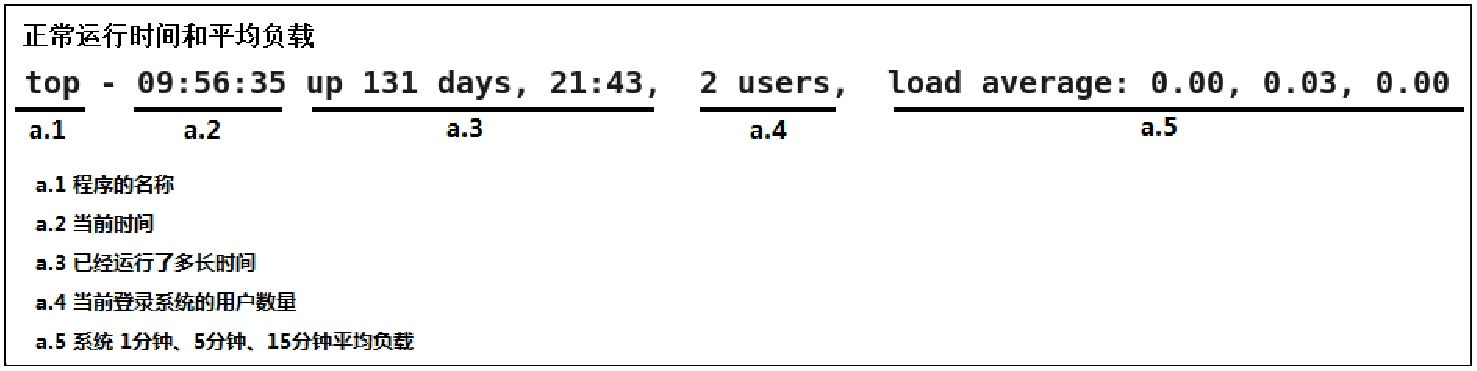
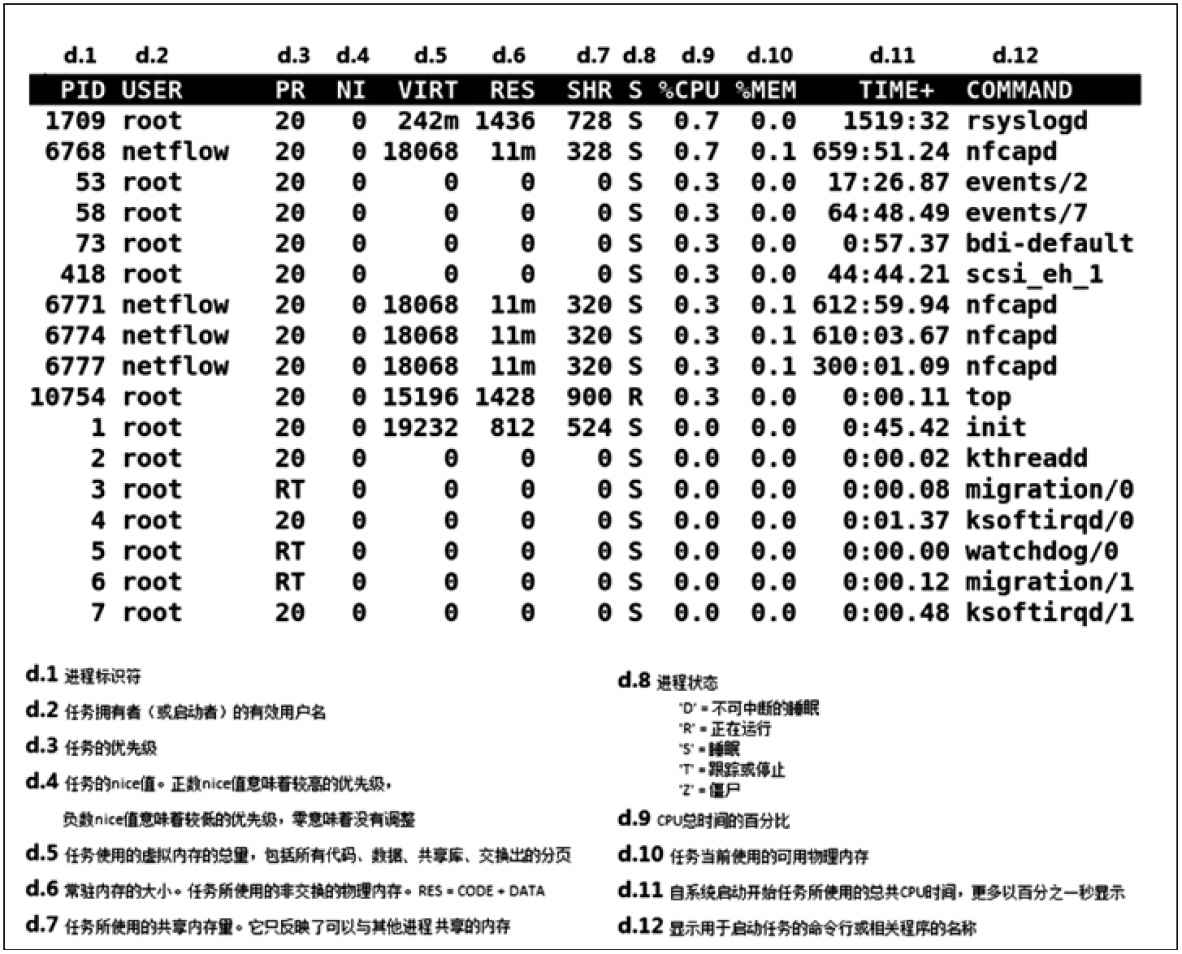
10. top
$ top
top - 00:15:40 up 21:56, 1 user, load average: 31.09, 29.87, 29.92
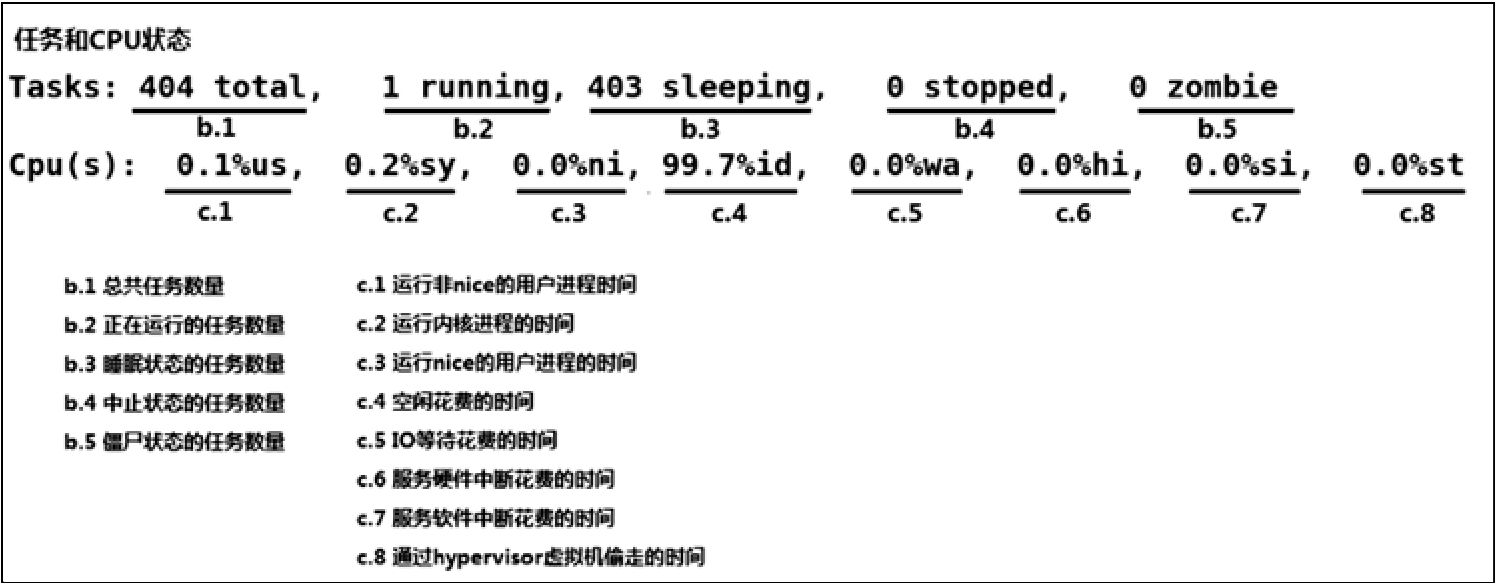
Tasks: 871 total, 1 running, 868 sleeping, 0 stopped, 2 zombie
%Cpu(s): 96.8 us, 0.4 sy, 0.0 ni, 2.7 id, 0.1 wa, 0.0 hi, 0.0 si, 0.0 st
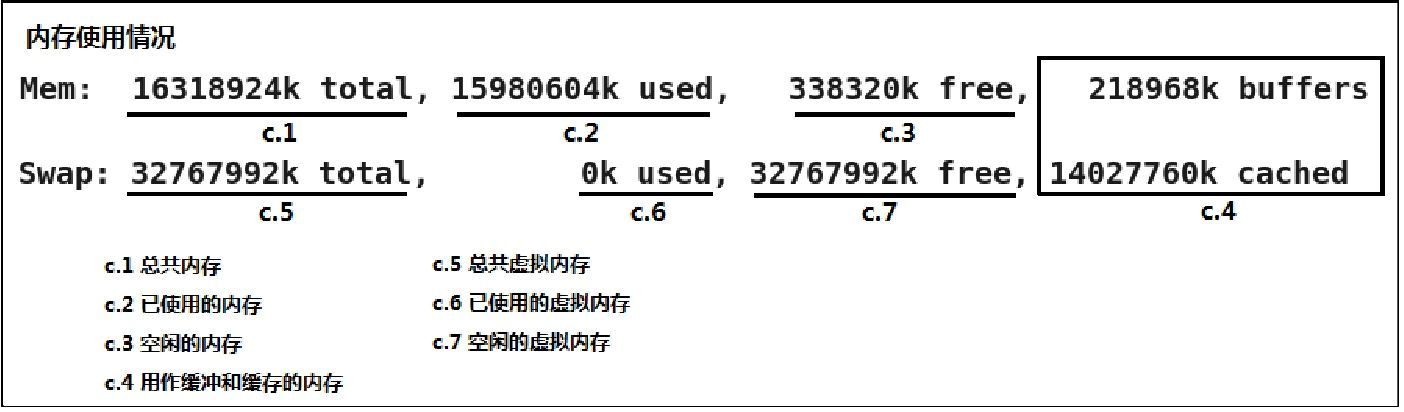
KiB Mem: 25190241+total, 24921688 used, 22698073+free, 60448 buffers
KiB Swap: 0 total, 0 used, 0 free. 554208 cached Mem
PID USER PR NI VIRT RES SHR S %CPU %MEM TIME+ COMMAND
20248 root 20 0 0.227t 0.012t 18748 S 3090 5.2 29812:58 java
4213 root 20 0 2722544 64640 44232 S 23.5 0.0 233:35.37 mesos-slave
66128 titancl+ 20 0 24344 2332 1172 R 1.0 0.0 0:00.07 top
5235 root 20 0 38.227g 547004 49996 S 0.7 0.2 2:02.74 java
4299 root 20 0 20.015g 2.682g 16836 S 0.3 1.1 33:14.42 java
1 root 20 0 33620 2920 1496 S 0.0 0.0 0:03.82 init
2 root 20 0 0 0 0 S 0.0 0.0 0:00.02 kthreadd
3 root 20 0 0 0 0 S 0.0 0.0 0:05.35 ksoftirqd/0
5 root 0 -20 0 0 0 S 0.0 0.0 0:00.00 kworker/0:0H
6 root 20 0 0 0 0 S 0.0 0.0 0:06.94 kworker/u256:0
8 root 20 0 0 0 0 S 0.0 0.0 2:38.05 rcu_sched
The top command includes many of the metrics we checked earlier. It can be handy to run it to see if anything looks wildly different from the earlier commands, which would indicate that load is variable.
iotop
Children